
✦ New: Product Performance
See what you sold, what it cost, and what it made: by product, by day
Units sold, gross sales, cost of goods, and net profit for every product and variant, on any day or date range you choose. Easily spot your most profitable products, and your most returned.
Scope: Product Performance subtracts cost of goods (COGS) only. It's a net profit view per SKU. Shipping, transaction fees, and ad spend aren't allocated down to individual products and are covered store-wide in Juicy's Profit & Loss report instead.
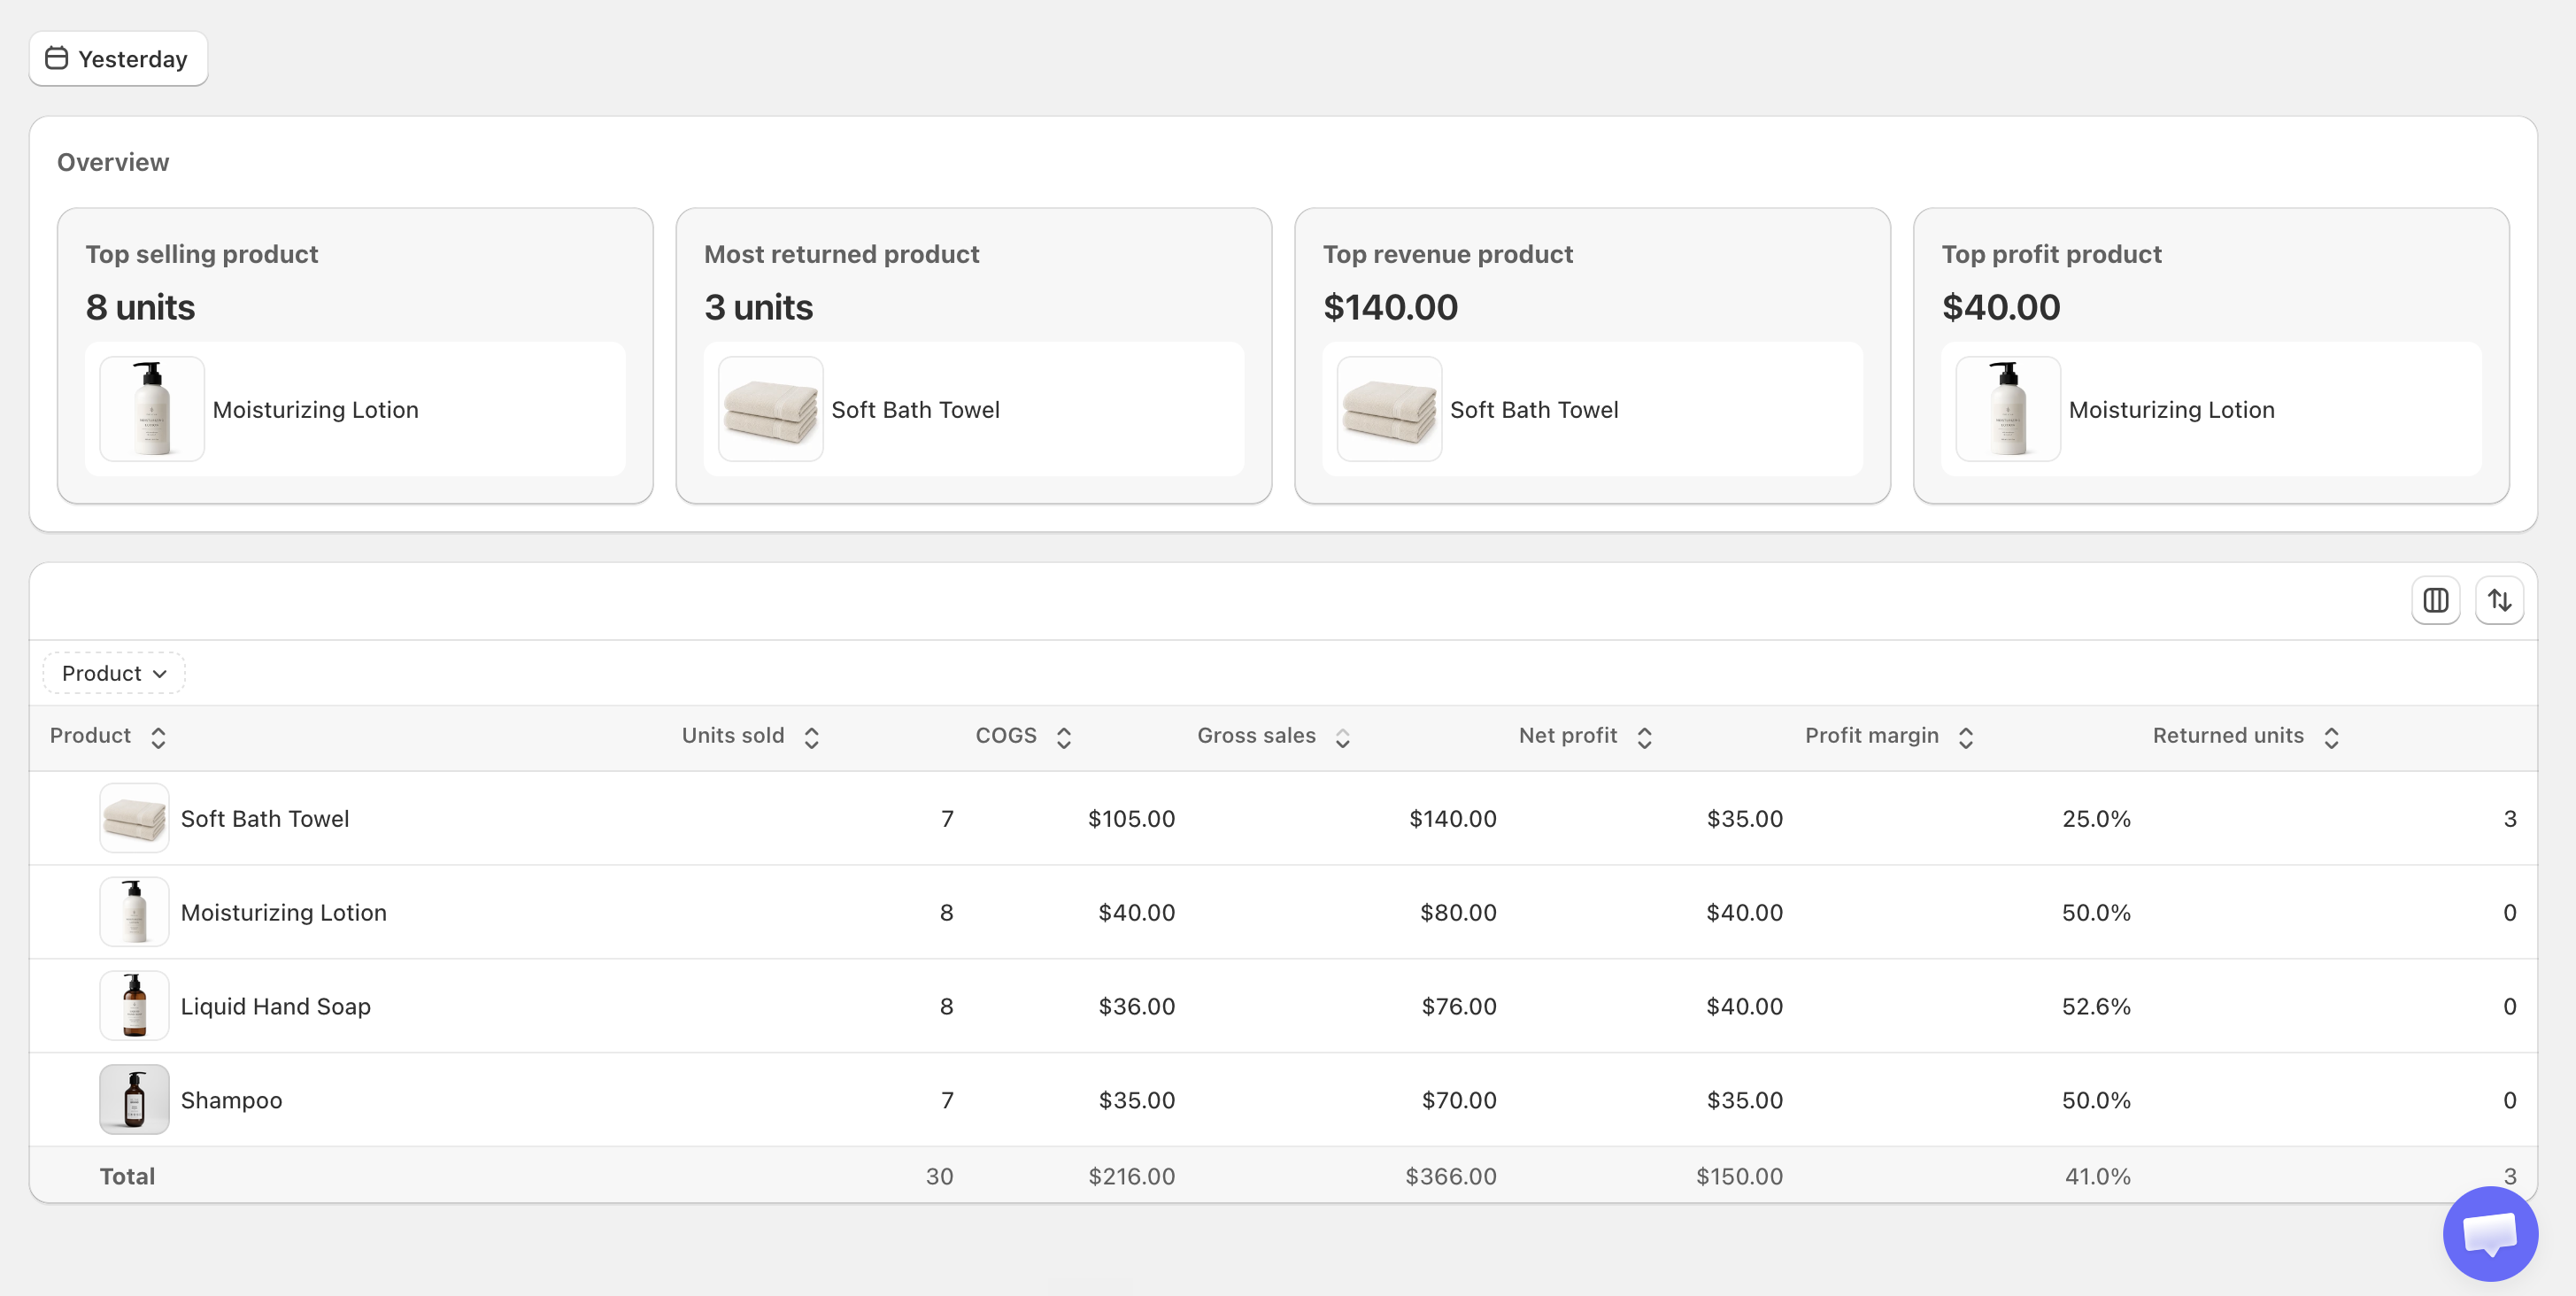
Sales: products & variants
Units sold, gross sales, COGS, net profit, profit margin, and returned units, per product, and per variant on the Sales: variants tab. Four widgets surface the outliers first: top-selling, most-returned, top-revenue, and top-profit product, which isn't always the same item.
Why product-level net profit changes decisions
Once net profit is visible per product and variant, a few patterns tend to show up immediately.
Revenue leaders aren't always profit leaders
A best-seller with thin margins or a high return rate can quietly make less net profit than a slower, higher-margin product.
Returns eat margin unevenly
The "most returned product" widget surfaces the SKU that's costing you the most in reverse logistics, before it shows up in a quarterly review.
Any period, same comparison
Pick today, last 30 days, or a custom range and instantly see how units sold and net profit shift, useful for checking a sale or campaign in isolation.
Marketing budget follows real margin
Knowing net profit per product means ad spend and promotions can be pointed at what's actually worth scaling, not just what sells the most units.
FAQ
What is a product performance report in Shopify?
A product performance report shows how each product (and variant) is actually doing, not just how many units sold. Juicy's version combines units sold, gross sales, cost of goods (COGS), net profit, profit margin, and returned units for every product and variant, over any date range you choose, so you can see which items are genuinely profitable and which only look good on revenue alone.
How does Juicy calculate net profit per product?
Juicy takes each product's gross sales for the selected period and subtracts its cost of goods sold (COGS), using the quantity-based and country-specific cost rules you've configured. That result is the product's net profit, shown alongside profit margin (net profit divided by gross sales). Product Performance deducts COGS only. It does not allocate shipping, transaction fees, or ad spend down to individual products, since those costs aren't tied to a single SKU. Store-wide net profit, including those costs, lives in Juicy's Profit & Loss report.
Can I choose a specific date range to see units sold and profit?
Yes. Product Performance is filtered by date range: today, the last 30 days, or any custom period, and every number in the report, from units sold to net profit, recalculates for that period. This makes it easy to compare how a product performed last week versus last month, or during a specific campaign or sale.
Can I see profit by variant, not just by product?
Yes. Juicy's Product Performance report has a dedicated Sales: variants view, so you can drill down past the product level and see units sold, gross sales, COGS, net profit, and margin for each individual variant: size, color, or SKU.
Related: Stock & days of inventory · Frequently bought together
See net profit by product on your own store
Stop guessing from revenue. Start making decisions from margin.
Install Juicy on Shopify